How to Use Bollinger Bands Combined with RSI for Profitable Trades
Bollinger Bands and the Relative Strength Index (RSI) are two of the most widely used technical indicators in trading. When combined, they create a powerful strategy for identifying profitable trades by helping traders identify overbought and oversold conditions, as well as price reversals and breakouts. Here’s how to use them effectively in your trading strategy.
Bollinger Bands: Understanding the Basics
Bollinger Bands consist of three lines:
- The middle band is a simple moving average (SMA), typically set to 20 periods.
- The upper band and lower band are set at two standard deviations above and below the middle band, respectively.
When the price touches or moves beyond the upper or lower band, it suggests that the asset is either overbought or oversold, and may soon experience a reversal or consolidation.
RSI: Measuring Market Momentum
The RSI is a momentum oscillator that measures the speed and change of price movements. It ranges from 0 to 100, with levels above 70 indicating an overbought market and levels below 30 signaling an oversold market. The RSI helps confirm potential price reversals signaled by the Bollinger Bands.
Combining Bollinger Bands and RSI for Profit
The power of combining these two indicators lies in their ability to filter out false signals and enhance your trading decisions. Here’s how:
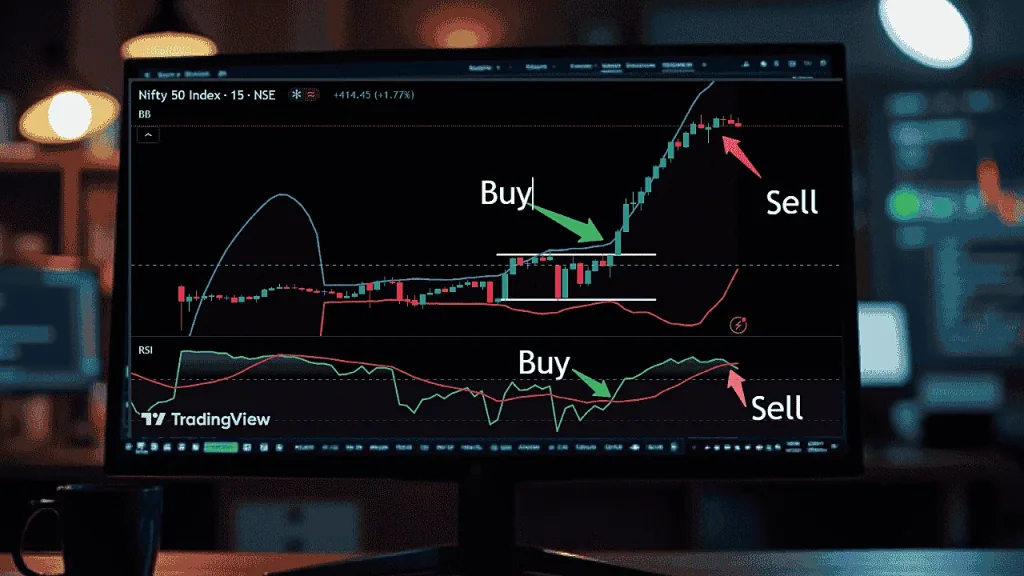
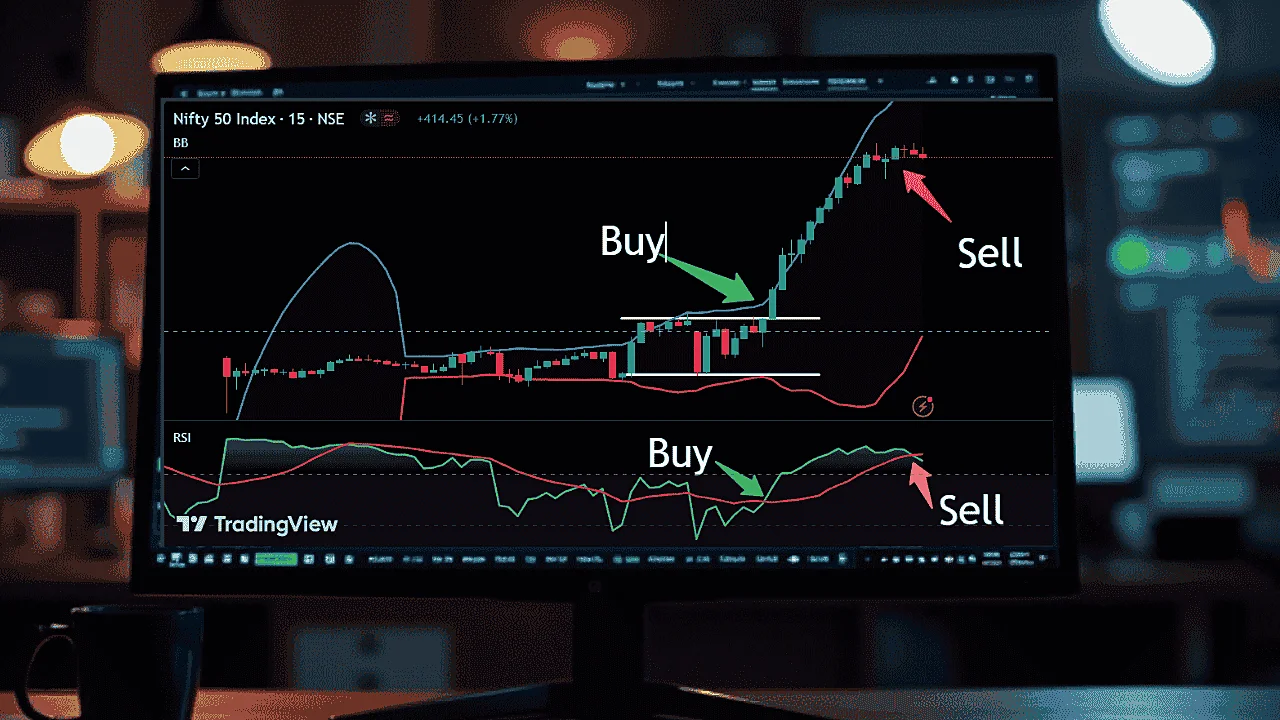
- Buy Signal: When the price touches or breaks the lower Bollinger Band and the RSI is below 30 (indicating an oversold condition), it often signals a buy opportunity. This suggests that the market has been excessively sold off and could be primed for a reversal.
- Sell Signal: Conversely, when the price touches or breaks the upper Bollinger Band and the RSI is above 70 (indicating an overbought condition), it’s a sell signal. This suggests the market may be overextended, and a pullback or reversal could occur soon.

Example in Practice
Imagine a stock’s price hits the lower Bollinger Band while the RSI falls below 30. This setup suggests an oversold condition, making it a potential entry point for a long position. Conversely, if the price breaks through the upper band while the RSI exceeds 70, a short position could be considered to capitalize on an overbought market.
By using both the Bollinger Bands and RSI together, traders can make more informed decisions, improving accuracy and profitability in their trades.
